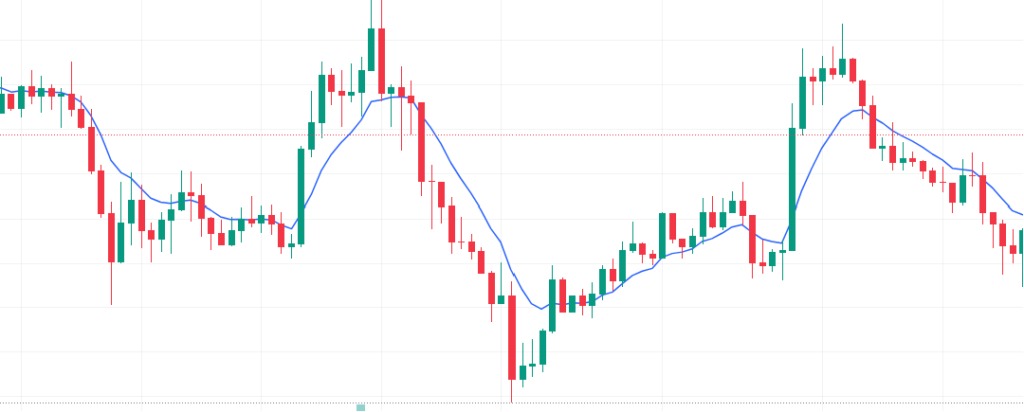
Moving averages (MAs) are a common type of technical indicator used in financial analysis, specifically to understand trends and support/resistance levels. They help smooth out price fluctuations, making it easier to identify the underlying trend in a security’s price.
Here’s a breakdown of moving averages:
- Concept:
- Moving averages calculate the average price of a security over a chosen period (e.g., 50 days, 200 weeks).
- As the name suggests, it’s a “moving” average because the calculation is repeated with each new price point, discarding the oldest data point and including the latest price.
- This creates a line on a chart that reflects the average price trend over the chosen period.
- Types of moving averages:
- Simple moving average (SMA): This is the most basic type, where all the prices in the chosen period are given equal weight in the calculation.
- Exponential moving average (EMA): This assigns more weight to recent prices, making it more responsive to new information and quicker to react to trend changes.
- Interpreting moving averages:
- A rising moving average suggests an uptrend, while a falling moving average indicates a downtrend.
- The slope of the moving average line can also signal the strength of the trend.
- The price crossing above or below the moving average line can be used by some traders to generate buy or sell signals.
- Limitations of moving averages:
- Moving averages lag behind actual price movements, so they may not capture very sharp trends or sudden price changes.
- They rely on historical data and don’t predict the future, so they should be used in conjunction with other forms of analysis.
Overall, moving averages are a valuable tool for understanding trends and potential support/resistance levels in the market. However, it’s important to remember their limitations and use them in combination with other strategies for effective trading decisions.

